rland_a |>
ggplot() +
theme(
panel.background = element_rect(fill = "aliceblue", color = NA)
) +
geom_sf(fill = "antiquewhite1", color = "burlywood3") +
geom_sf(data = st_buffer(rland_a, -6000), linewidth = 0.6, fill = NA, color = alpha("burlywood3", 0.4)) +
geom_sf(data = st_buffer(rland_a, 6000), linewidth = 0.4, fill = NA, color = alpha(c("lightblue"), 0.7)) +
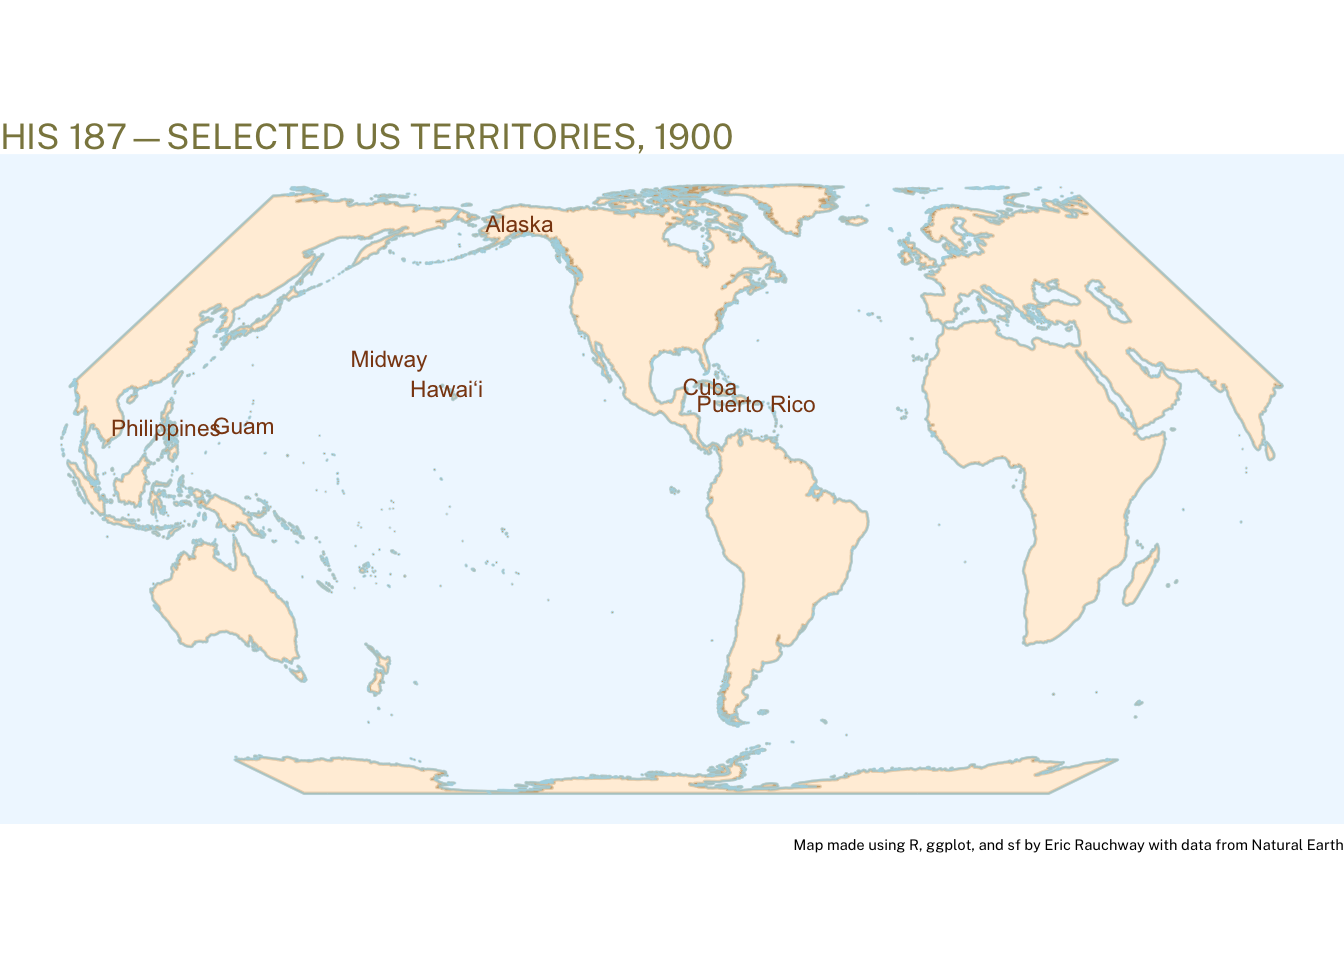
geom_sf_text(data = us_places, aes(label = name), color = "chocolate4", size = 3) +
labs(
title = "HIS 187---SELECTED US TERRITORIES, 1900",
caption = my_cap
) -> p
p