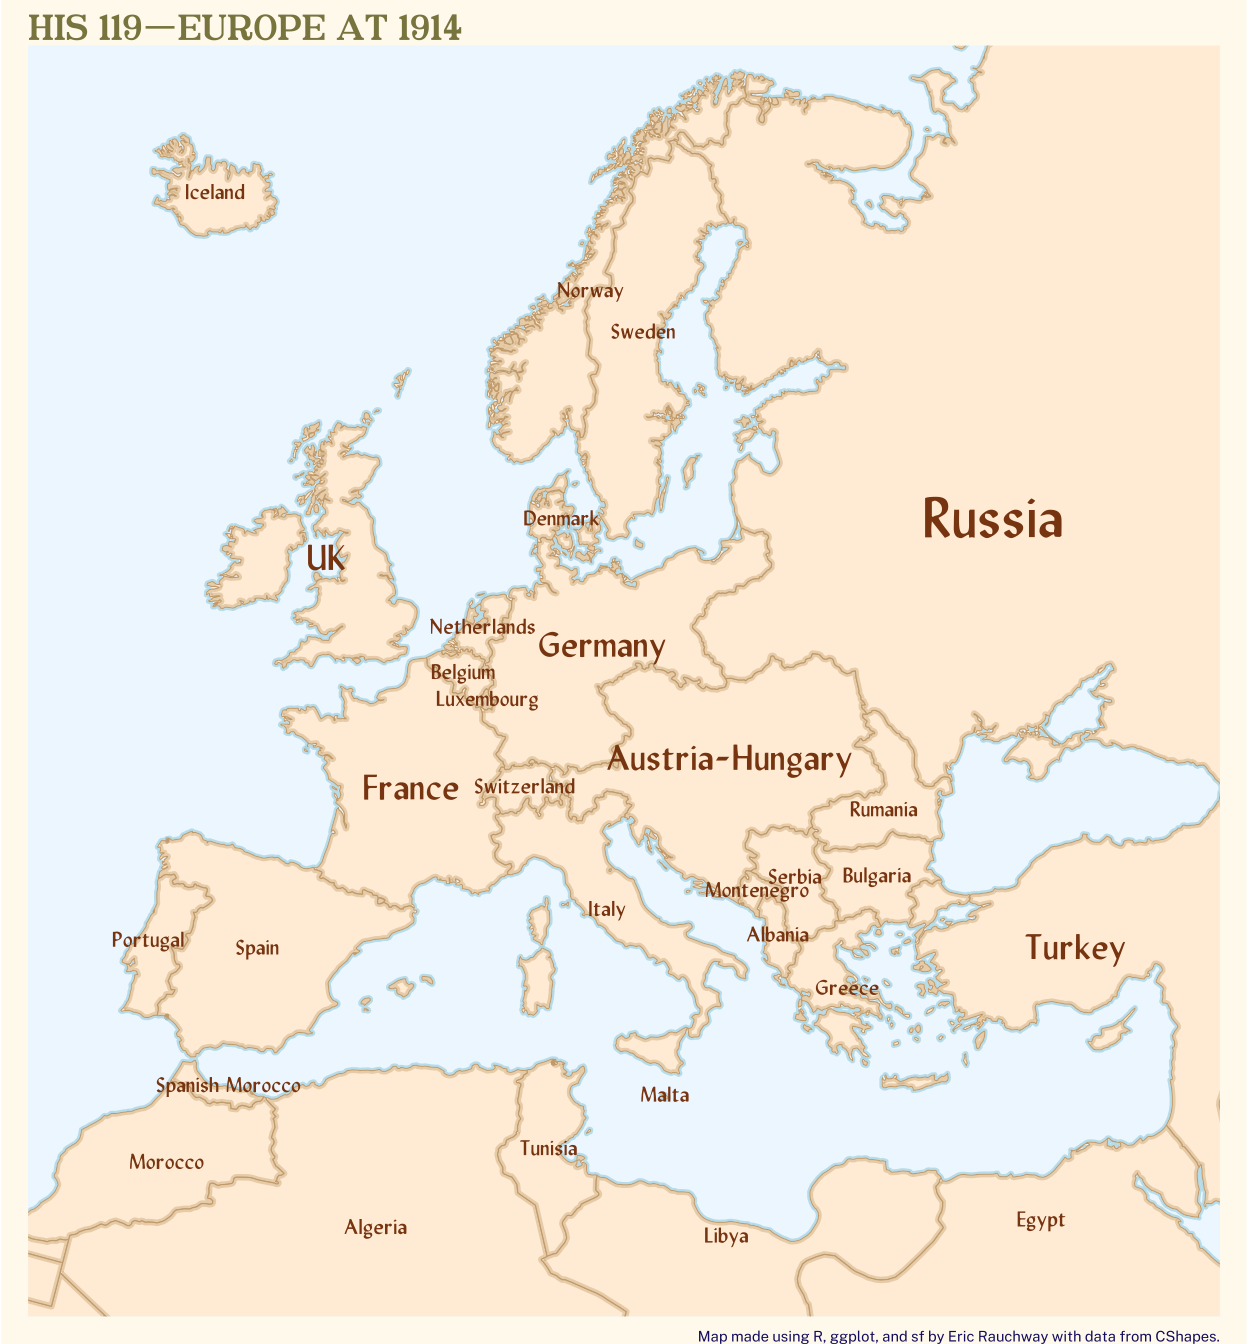
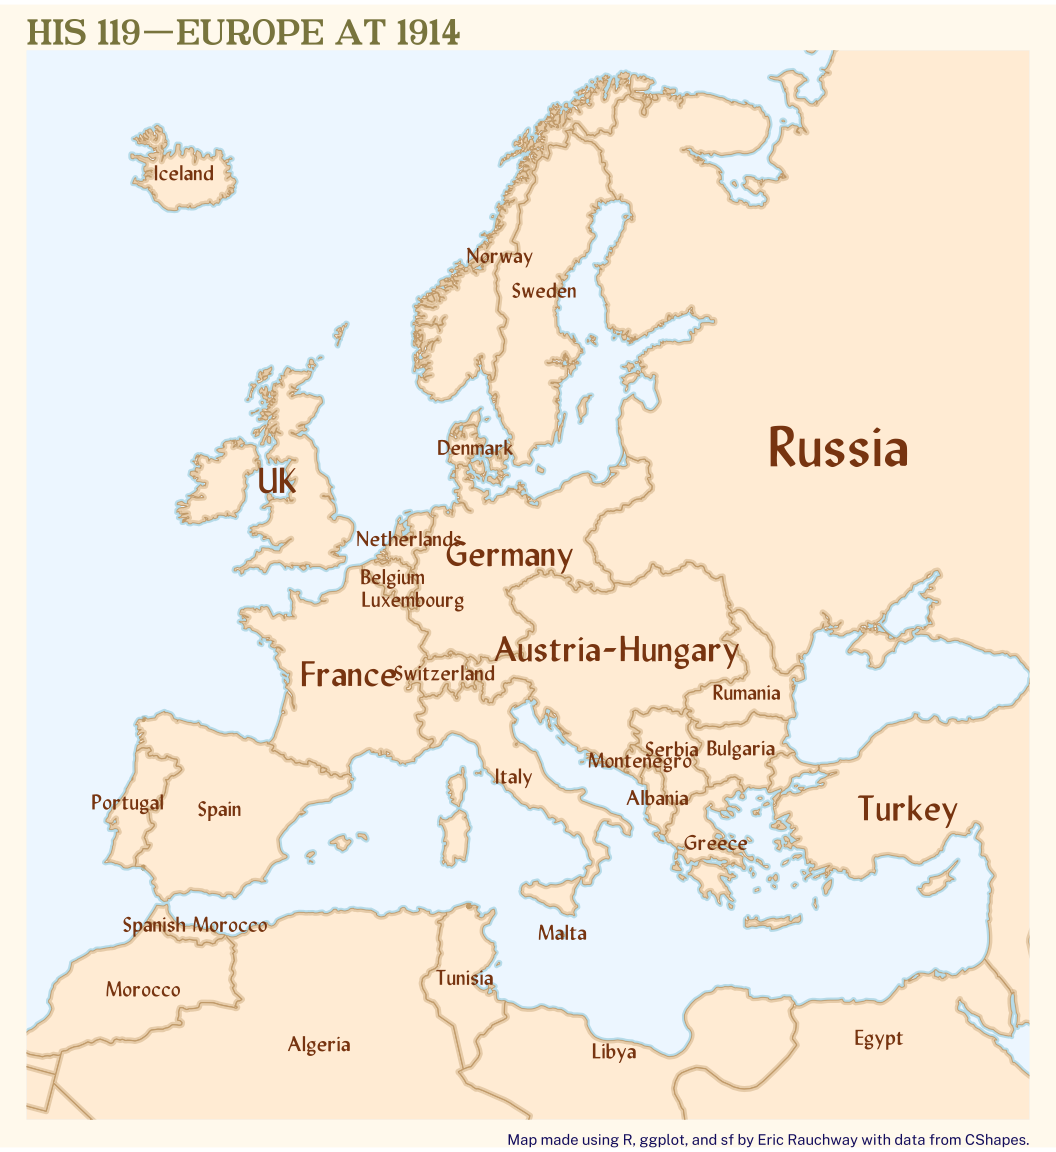
ggplot() +geom_sf(data = borders_14, fill ="antiquewhite1", color ="burlywood3") +geom_sf(data =st_buffer(borders_14, -6000), linewidth =0.6, fill =NA, color =alpha("burlywood3", 0.4)) +geom_sf(data =st_buffer(st_union(st_make_valid(borders_14)), 6000), linewidth =0.4, fill =NA, color =alpha(c("lightblue"), 0.7)) +geom_richtext(data = borders_14,mapping =aes(X, Y, label = mylab),size = borders_14$siz +1,family ="Lydian",fill =NA, color ="chocolate4",label.color =NA, nudge_x = borders_14$nx, nudge_y = borders_14$ny, na.rm =TRUE) +labs(title ="HIS 119---EUROPE AT 1914",caption ="Map made using R, ggplot, and sf by Eric Rauchway with data from CShapes." ) +coord_sf(xlim = disp_win_coord[,'X'], ylim = disp_win_coord[, 'Y'], expand =TRUE) -> pp